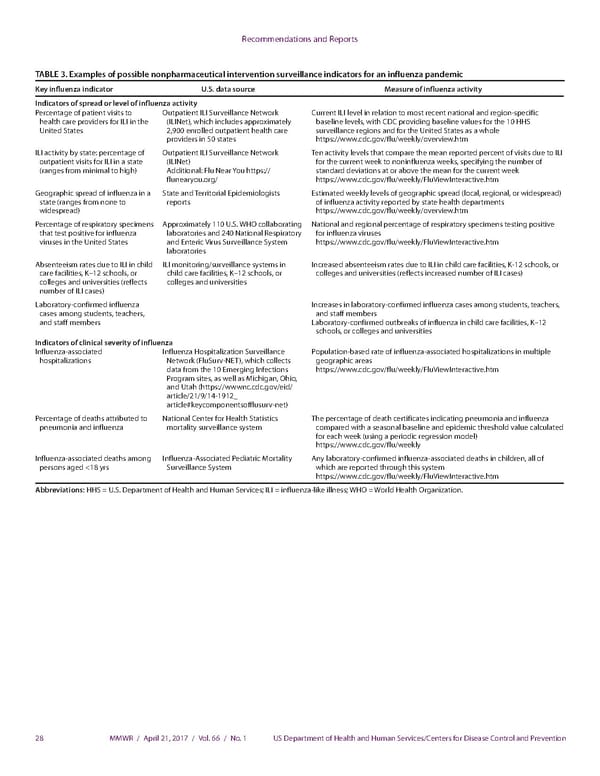
Recommendations and Reports TABLE 3. Examples of possible nonpharmaceutical intervention surveillance indicators for an influenza pandemic Key influenza indicator U.S. data source Measure of influenza activity Indicators of spread or level of influenza activity Percentage of patient visits to Outpatient ILI Surveillance Network Current ILI level in relation to most recent national and region-specific health care providers for ILI in the (ILINet), which includes approximately baseline levels, with CDC providing baseline values for the 10 HHS United States 2,900 enrolled outpatient health care surveillance regions and for the United States as a whole providers in 50 states https://www.cdc.gov/flu/weekly/overview.htm ILI activity by state: percentage of Outpatient ILI Surveillance Network Ten activity levels that compare the mean reported percent of visits due to ILI outpatient visits for ILI in a state (ILINet) for the current week to noninfluenza weeks, specifying the number of (ranges from minimal to high) Additional: Flu Near You https:// standard deviations at or above the mean for the current week flunearyou.org/ https://www.cdc.gov/flu/weekly/FluViewInteractive.htm Geographic spread of influenza in a State and Territorial Epidemiologists Estimated weekly levels of geographic spread (local, regional, or widespread) state (ranges from none to reports of influenza activity reported by state health departments widespread) https://www.cdc.gov/flu/weekly/overview.htm Percentage of respiratory specimens Approximately 110 U.S. WHO collaborating National and regional percentage of respiratory specimens testing positive that test positive for influenza laboratories and 240 National Respiratory for influenza viruses viruses in the United States and Enteric Virus Surveillance System https://www.cdc.gov/flu/weekly/FluViewInteractive.htm laboratories Absenteeism rates due to ILI in child ILI monitoring/surveillance systems in Increased absenteeism rates due to ILI in child care facilities, K-12 schools, or care facilities, K–12 schools, or child care facilities, K–12 schools, or colleges and universities (reflects increased number of ILI cases) colleges and universities (reflects colleges and universities number of ILI cases) Laboratory-confirmed influenza Increases in laboratory-confirmed influenza cases among students, teachers, cases among students, teachers, and staff members and staff members Laboratory-confirmed outbreaks of influenza in child care facilities, K–12 schools, or colleges and universities Indicators of clinical severity of influenza Influenza-associated Influenza Hospitalization Surveillance Population-based rate of influenza-associated hospitalizations in multiple hospitalizations Network (FluSurv-NET), which collects geographic areas data from the 10 Emerging Infections https://www.cdc.gov/flu/weekly/FluViewInteractive.htm Program sites, as well as Michigan, Ohio, and Utah (https://wwwnc.cdc.gov/eid/ article/21/9/14-1912_ article#keycomponentsofflusurv-net) Percentage of deaths attributed to National Center for Health Statistics The percentage of death certificates indicating pneumonia and influenza pneumonia and influenza mortality surveillance system compared with a seasonal baseline and epidemic threshold value calculated for each week (using a periodic regression model) https://www.cdc.gov/flu/weekly Influenza-associated deaths among Influenza-Associated Pediatric Mortality Any laboratory-confirmed influenza-associated deaths in children, all of persons aged <18 yrs Surveillance System which are reported through this system https://www.cdc.gov/flu/weekly/FluViewInteractive.htm Abbreviations: HHS = U.S. Department of Health and Human Services; ILI = influenza-like illness; WHO = World Health Organization. 28 MMWR / April 21, 2017 / Vol. 66 / No. 1 US Department of Health and Human Services/Centers for Disease Control and Prevention
 Community Mitigation Guidelines to Prevent Pandemic Influenza Page 29 Page 31